Trading spare capacity: how your battery earns money on the spot market on the side
Self-consumption and peak shaving are the core job of a behind-the-meter battery, and that is what these systems are sized for in Furo. But for much of the time, the battery simply sits there, available. This available capacity can be marketed profitably on the power exchange. With flexibility marketing, Furo estimates what this free residual capacity can earn on top on the electricity market. This article explains how that works — no trading knowledge required — and why our figures are deliberately calculated conservatively.
The good news: Furo calculates, as its own building block of the profitability calculation, what residual capacity can generate in additional revenue through marketing. You neither have to approach a marketer nor run the simulation yourself.
How does trading with a battery storage system work?
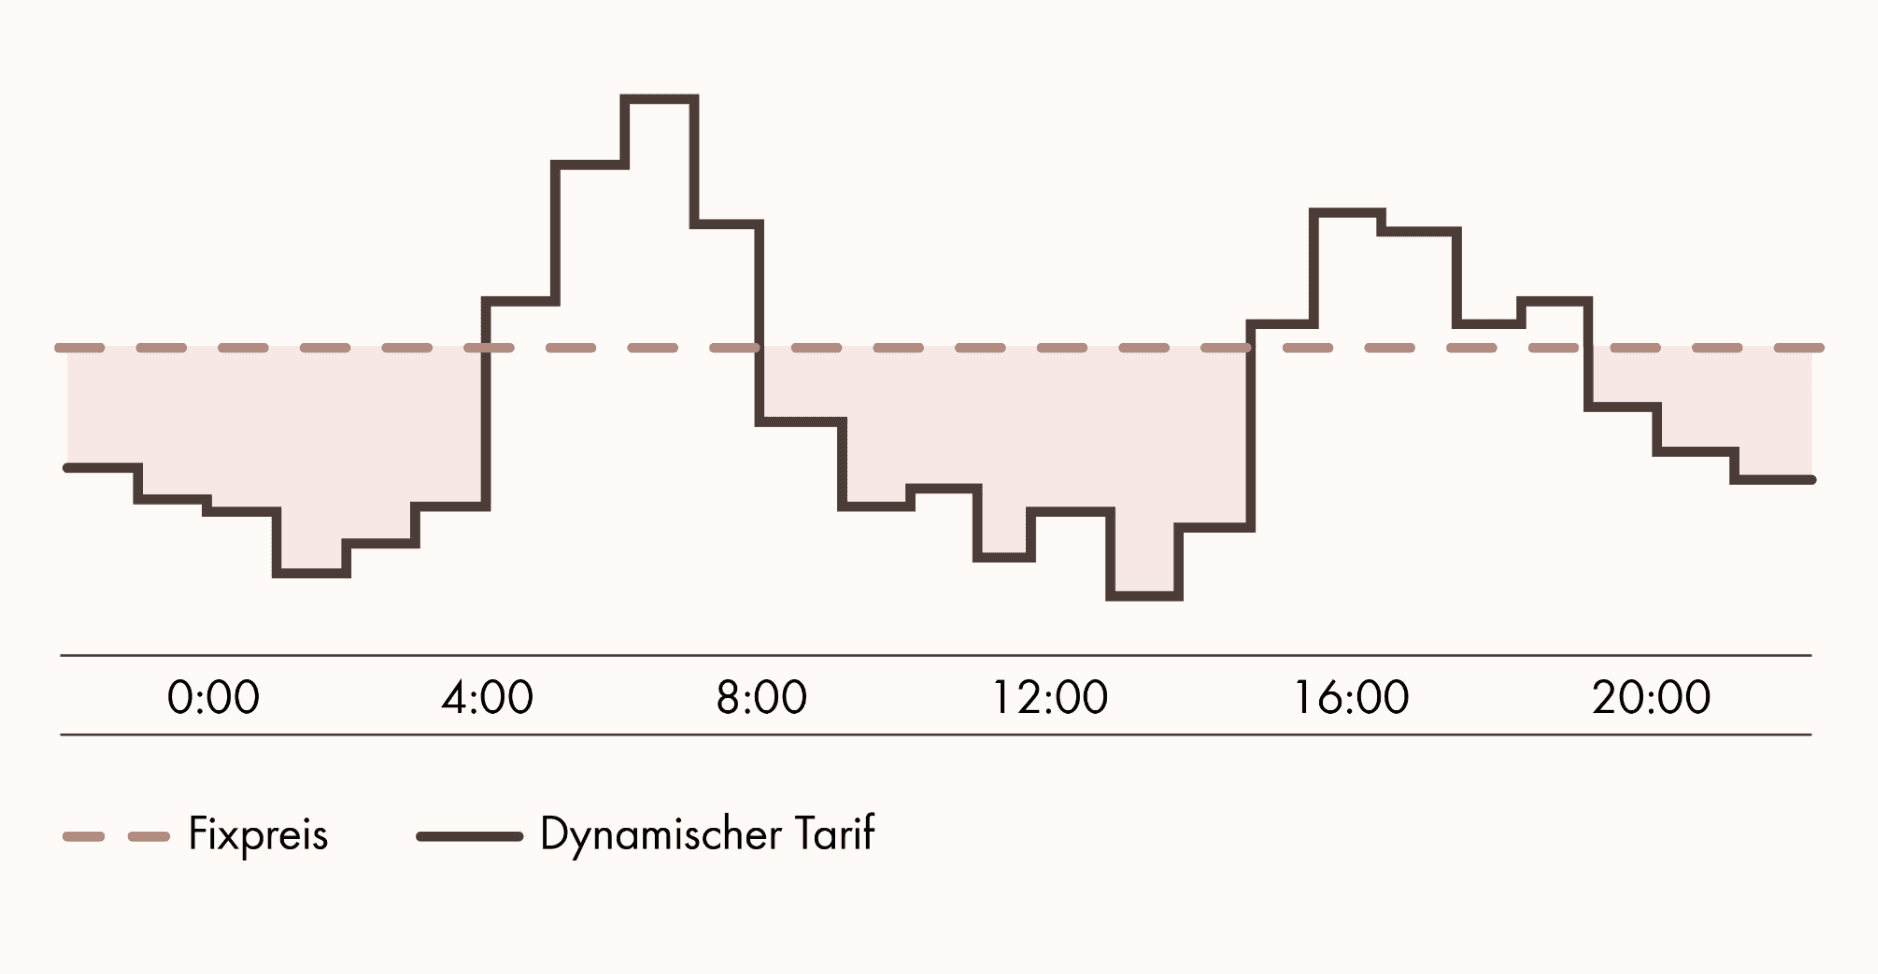
The basic principle is simple, and it is the same one that makes every battery economical: charge cheaply, discharge expensively. The only new element is the reference point. With self-consumption optimization, the battery compares the electricity price against the avoided grid supply costs. With trading, it compares the prices on the power trading market against each other over the course of the day.
These prices fluctuate strongly. On sunny days, PV feed-in pushes midday prices down, sometimes into negative territory. In the morning and evening, when the sun is missing and demand is high, they rise. A battery can capture this difference, the spread:
- It charges power from the grid in the cheap hour.
- It discharges in the expensive hour and sells the energy again.
- The difference, minus storage losses, is the gross margin.
An example: if a kilowatt-hour is bought at midday for 4 ct and sold in the evening for 16 ct, around 12 ct of margin remain after storage losses. Per cycle, on every day with enough spread. Over a year, that adds up despite efficiency losses.
On top of this comes another form of arbitrage: prices can vary between the individual markets. That can make it worthwhile to buy a volume of power on one market and sell it again on another. We call this virtual trading, because no electricity physically flows in the process. That also means no grid fees are incurred.
For this article, the difference between virtual and physical trading is not decisive. What matters is: in Furo we simulate both at the same time, and with that the entire trading of residual capacity across the power trading markets.
Marketing residual capacity without restricting self-consumption
The most important point first, because it creates confidence in customer conversations: marketing does not touch the battery's actual job. Self-consumption and peak shaving always take priority. Only what is left over is traded: the residual capacity.
Technically it works like this: Furo Plan first optimizes battery operation for the primary use case as usual. Only on top of this finished operating profile does the trading simulation build, and it uses nothing but the remaining headroom. Three safeguards secure this:
- Free headroom instead of full access. The model calculates at every point in time how much charging and discharging power is free once the primary use case has been served. Only this remainder is available for trading. If the battery is fully utilized, trading gets nothing.
- Energy neutrality. At the end of the period, the battery ends up at exactly the state of charge the primary use case would have needed anyway. Trading only shifts energy in time; it cannot "take anything away" from self-consumption.
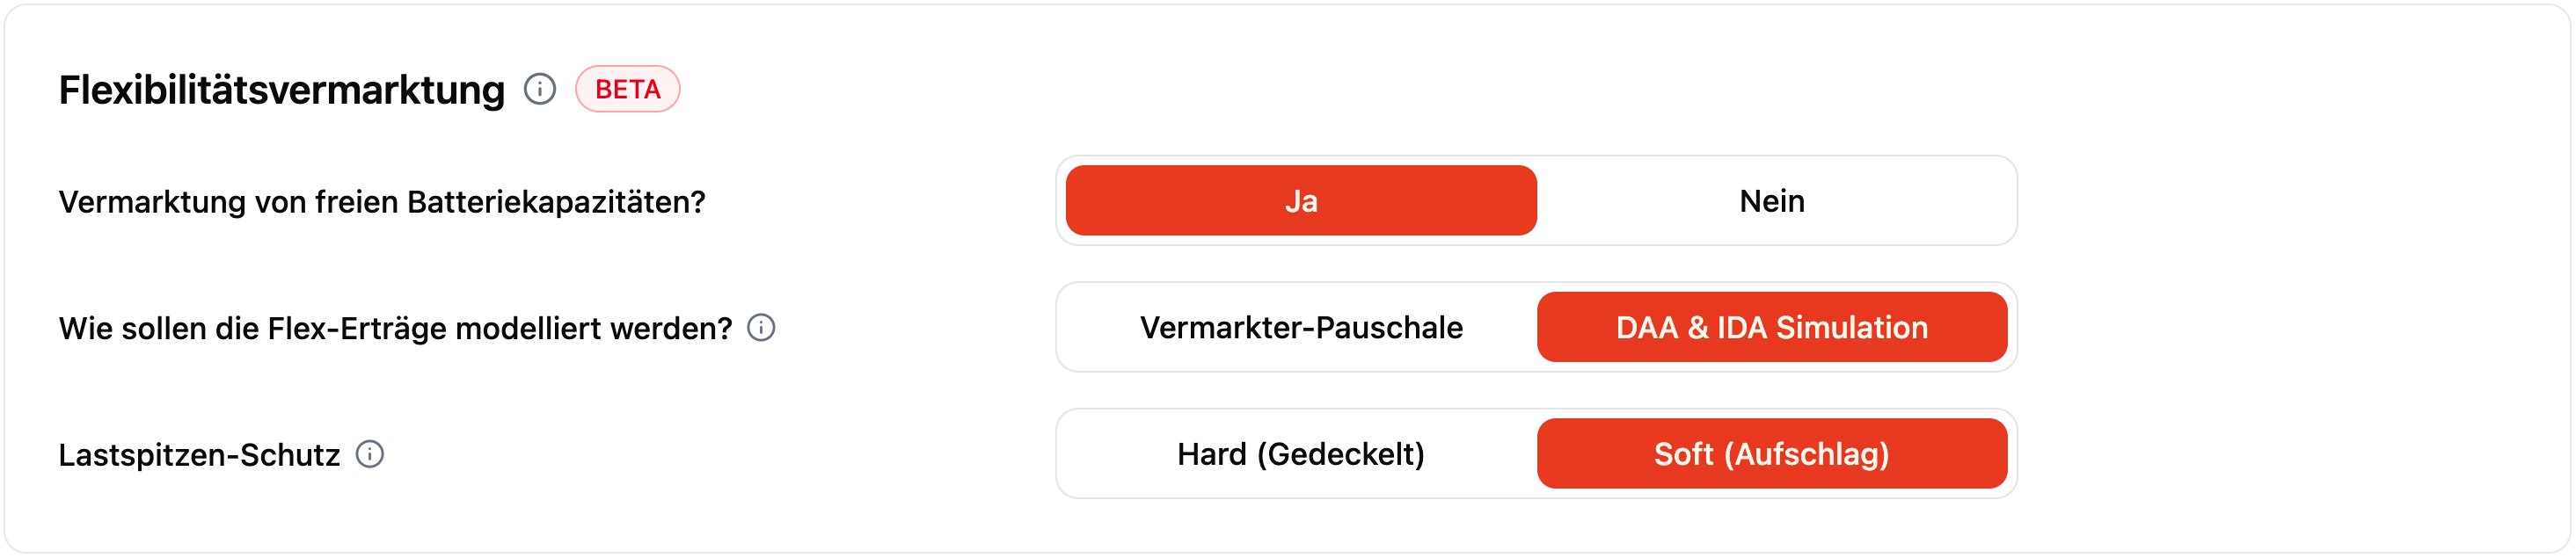
- Peak load protection. Trading must not undo the expensively achieved peak shaving. There are two modes for this in the simulation: Hard (capped) prohibits any grid supply above the existing peak; Soft (surcharge) allows it but applies the real demand price, so costs from a new peak are only accepted if trading can recoup them.
The marketed energy is therefore genuine additional revenue "on top" and not a compromise at the expense of the core business.
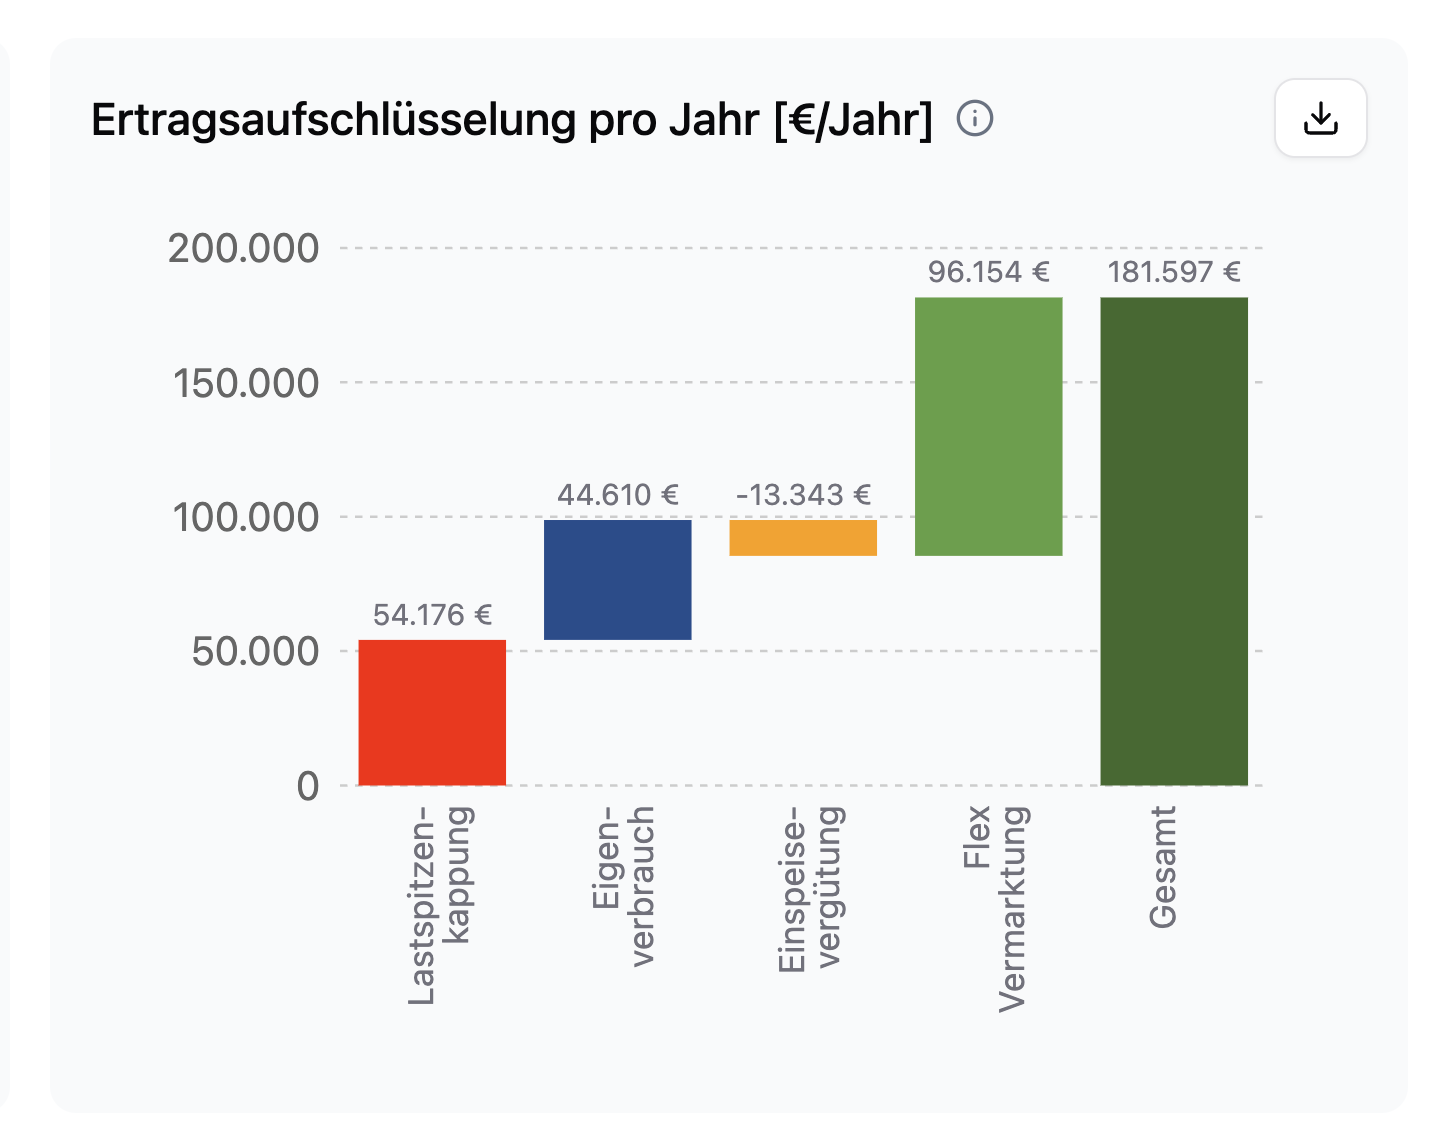
Flexibility marketing can generate considerable additional revenue, especially for large batteries.
DAA and IDA: the two markets we simulate
Wholesale power trading does not take place at a single marketplace, but in several stages that become increasingly short-term. For battery residual capacity, two of them matter above all — and those are exactly what our simulation maps:
- DAA, day-ahead auction. Here power is traded for the following day in fixed time blocks. By midday of the previous day, all market participants submit their buy and sell bids, from which a uniform price results for each block. For the battery this means, concretely: in the cheapest blocks it buys power and charges, in the most expensive it sells and discharges. The simulation fixes this schedule for the whole of the following day. The DAA is the most liquid and most predictable market and forms the basic framework.
- IDA, intraday auction. Closer to the delivery day, a further auction follows with a finer, quarter-hourly resolution. It supplements the day-ahead schedule: where prices fluctuate more strongly on a quarter-hourly basis or have shifted compared with the previous day, the battery builds additional positions. It can also partially unwind a DAA position, for example buying back a planned sale if that is cheaper on the IDA. In this way, the IDA extracts additional margin from the more short-term price differences. (This is what is known as virtual trading.)
Two further revenue sources are deliberately not included:
- continuous intraday trading (IDC), in which trading runs right up to shortly before delivery, and
- balancing energy (FCR, aFRR), with which batteries stabilize the grid frequency.
In practice, both often generate additional revenue. We leave them out because they depend more strongly on the marketer, pool size and market access, and are harder to forecast. What the software reports is the robust baseline from the two well-modelable auction markets, not the upper limit.
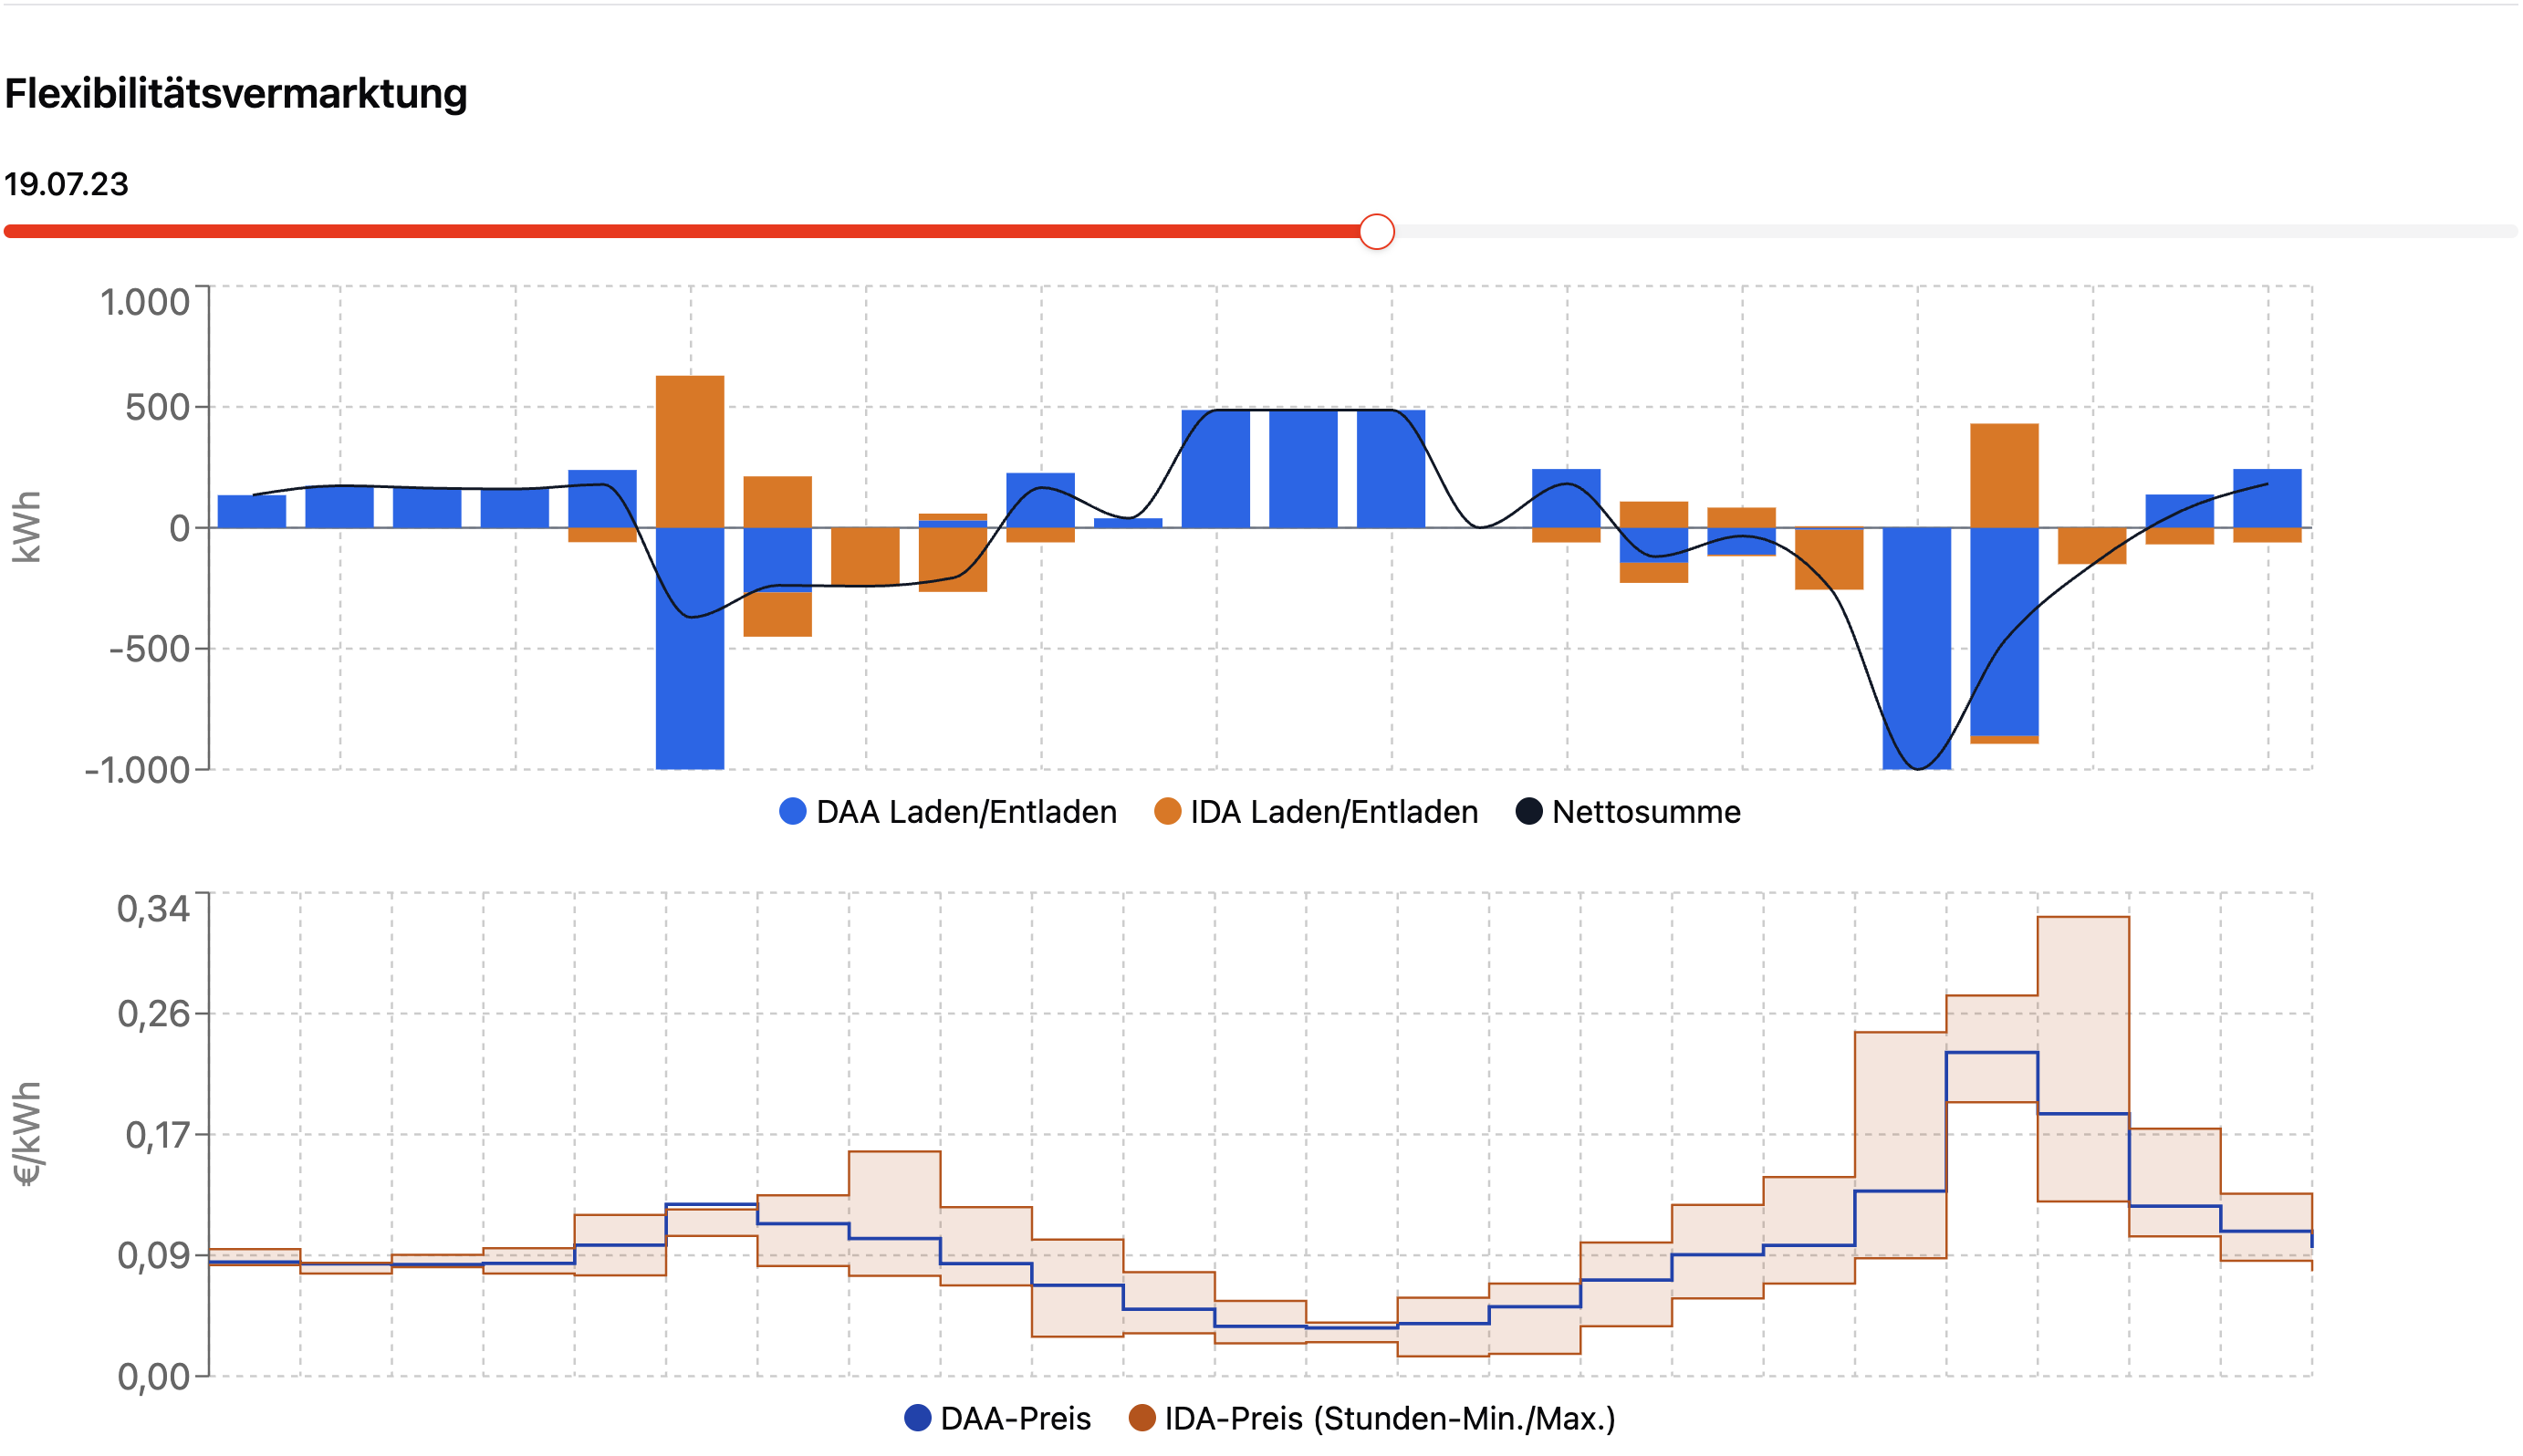
Depending on prices on the day-ahead and intraday markets, the simulation trades the available energy volumes.
Grid fees: the assumption everything rests on
Why does arbitrage pay off at all? The decisive factor is grid fees. If every kilowatt-hour charged incurred the full grid fees, the spread between purchase and sale would usually be eaten up and trading would be of little benefit.
Here, however, Section 118 (6) EnWG applies: batteries commissioned before August 2029 are exempt from grid fees on the energy they store for 20 years. For pure trading flows (grid into the battery and back into the grid), no grid fees with a financing function are therefore incurred. Only this makes marketing economical. Our simulation consistently accounts for this and values the charging power at the pure exchange price.
There are two consequences you should be aware of:
- The feature is Germany-specific. Grid fee exemption, price data and the demand price model are tailored to the German market (DE-LU bidding zone). That is why the DAA & IDA simulation is only available for German projects; otherwise it is grayed out.
- Regulation is changing. In 2026, the BNetzA confirmed that the exemption will expire as planned and that a moderate capacity fee will take its place in the medium term. Projects currently being planned are grandfathered; for very long analysis periods it is worth taking a look at the time horizon.
Why our estimate is conservative
Marketing figures are quickly calculated optimistically, and a simulation is still a long way from actual revenue. We have therefore deliberately designed the simulation conservatively; the reported earnings are more of a lower bound than a wish figure:
- Only the two robust auction markets. IDC and balancing energy are left out, so real revenue tends to be higher.
- Shared, strictly calculated cycle budget. Trading and the primary use case share a budget of around two full cycles per day. The trading cycles are added on top; the battery is not "talked up" and its service life stays protected.
- No speculation, no physically impossible trades. The simulation does not enter speculative positions and always trades only within the real charging and discharging limits of the battery. What is not physically possible is not bought either.
- Real historical prices. We calculate with the exchange prices that actually occurred in the matching year, not a hand-picked extreme year.
One assumption works in the other direction: the simulation knows the price curve and the battery's utilization in full and hits every good buying and selling moment. A real trading day works with forecasts and does not catch every high and low. Here, too, we have applied a conservative method. The algorithm first defines its trading positions on the day-ahead auction (within the physical limits of the battery). Only afterwards are the shorter-term trading positions optimized on the intraday market. That means perfect knowledge of price developments cannot be exploited and the simulation stays realistic. Even so, understand the result as well-founded guidance, not a guarantee. The actual level of the earnings achieved depends on the marketer and the quality of their trading.
The alternative: the marketer flat rate
Some customers are already in contact with a direct marketer who gives them their own estimate of what is achievable with the battery on the market. This is usually communicated as a rate in € per MW per year. You can factor exactly this estimate into Furo. That is what the second mode, the marketer flat rate, is for.
Instead of simulating the markets itself, it takes the marketer's figure and scales it down to your battery:
- You enter the rate quoted by the marketer (field "Expected revenue per MW per year"; typical values are around €50,000 to a few hundred thousand €/MW/year).
- Furo determines how much power remains free on average after self-consumption optimization and peak shaving.
- The annual revenue then results as: average free power × the marketer's rate.
This way you integrate a concrete marketer estimate directly into the profitability calculation, without your own market simulation.
The two modes are mutually exclusive per calculation and both feed into the same profitability calculation in the end: the additional revenue increases the annual savings and improves payback period, cash flow and net present value (NPV).
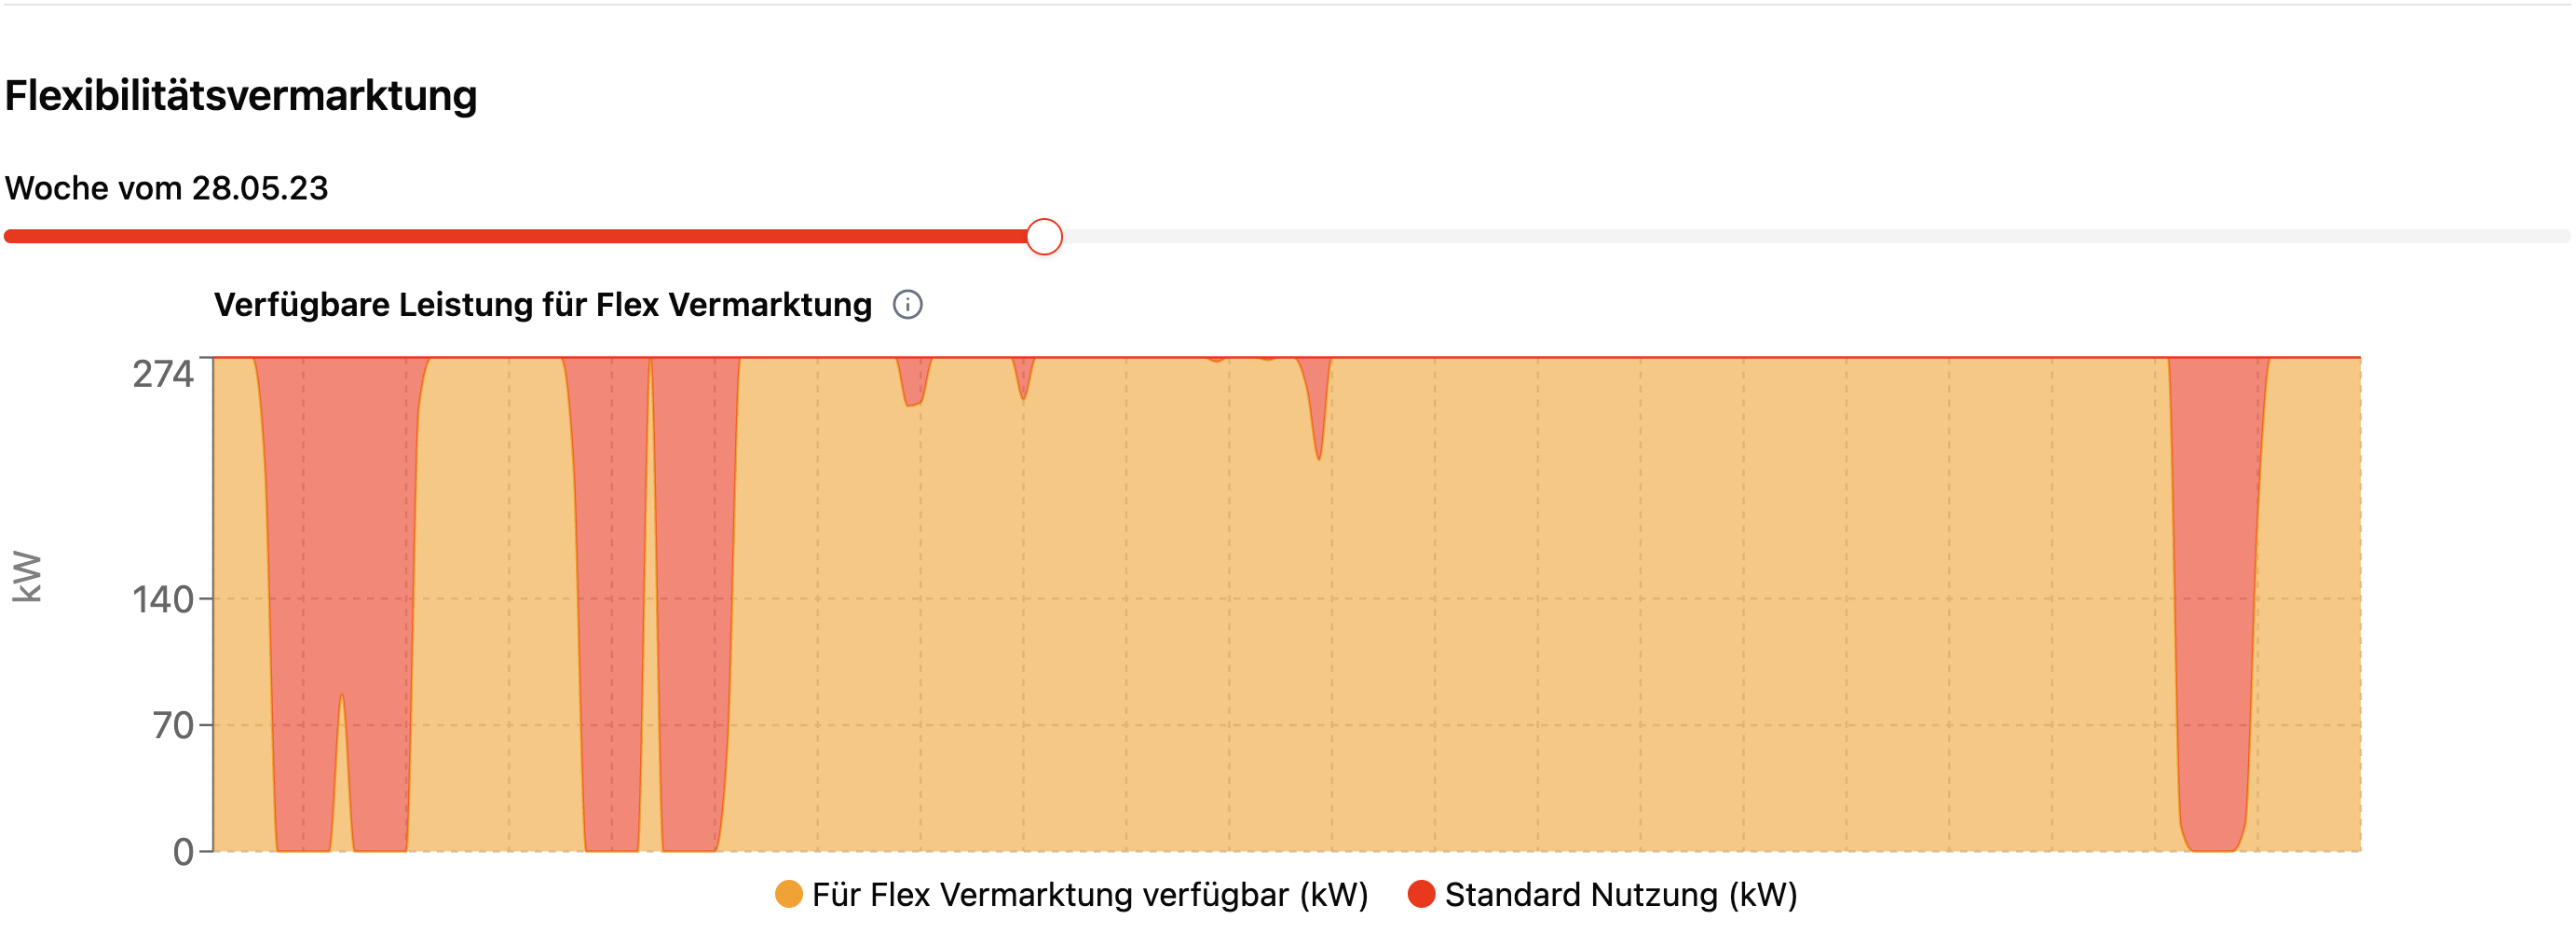
Furo models which power is available for marketing at which time.
Conclusion
Marketing residual capacity turns a battery that previously only optimized self-consumption and shaved peaks into an additional source of revenue, without curtailing its core tasks. With Furo you quantify this added value site-specifically, either as a dynamic DAA & IDA simulation or via the marketer flat rate. Because we limit ourselves to the robust auction markets, protect cycles and peak loads, and calculate with real prices, the earnings are a reliable, conservative basis for your quote.
For you in planning, that means: you show your customer on a solid basis what additional value lies in their battery — and you don't have to become a power trader yourself.
More Articles
Furo raises $4M from TQ Ventures, Neo and Sheryl Sandberg to build the operating system for industrial battery storage
Furo and LUOX Energy Launch Combined Solution for Optimizing Commercial and Industrial Battery Storage
MiSpeL Becomes Binding: Determination from October 2026, Transitional Phase until September 2027
Aging: Why Charging and Discharging an Industrial Battery Storage System for Arbitrage Doesn't Always Pay Off
Balancing Group and Balancing Energy: Why Storage Projects Lose Economic Viability During Operation
Why the dynamic rate plan is the first step toward flexible marketing, and what else you need