How battery storage really ages and how we model it
Batteries do not age linearly; they follow a curve that depends on cell chemistry and intensity of use. In addition to capacity loss, efficiency also declines over the lifetime, which is missing from many economic viability calculations. This article explains the physical background, compares cell chemistries and uses a practical example to show how realistic degradation modeling affects the business case.
How much capacity and efficiency does a battery storage system still have in year 10 or 15? The answer largely determines whether the investment pays off. At the same time, degradation is one of the aspects that are hardest to grasp in project planning: the data basis from manufacturer warranties is limited, and the underlying electrochemistry is complex.
By now, however, there are robust scientific models that reflect real aging behavior far better than a constant annual deduction. In this article we show what physically happens inside the battery, why degradation follows a curve and how this affects the business case.
What happens inside the battery: SEI growth as the driver
The aging of lithium-ion batteries is largely determined by the growth of the so-called solid electrolyte interphase (SEI). This thin layer forms on the graphite anode and binds lithium with every cycle, which is then no longer available for energy storage.
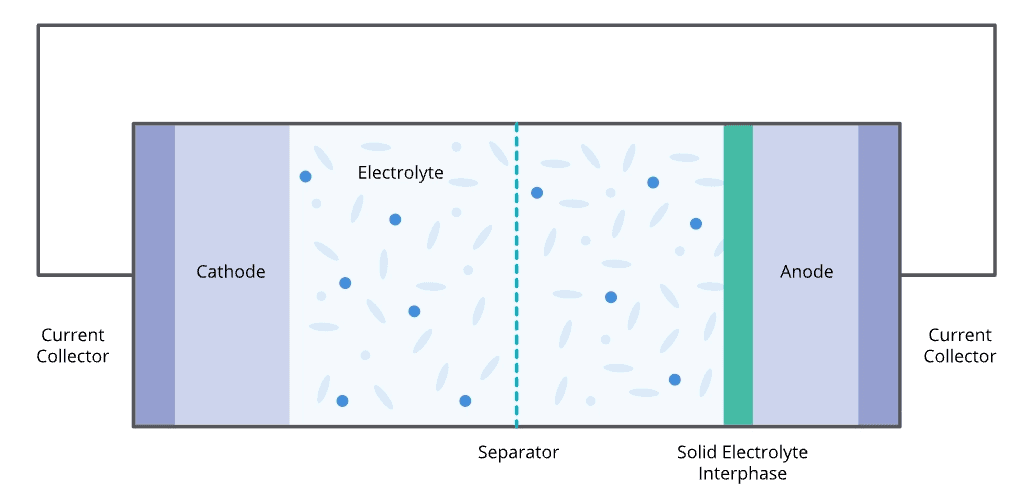
The decisive point: the SEI does not grow evenly. The thicker the layer becomes, the more it slows its own growth, similar to a sheet of ice on a lake that first thickens quickly and then ever more slowly.
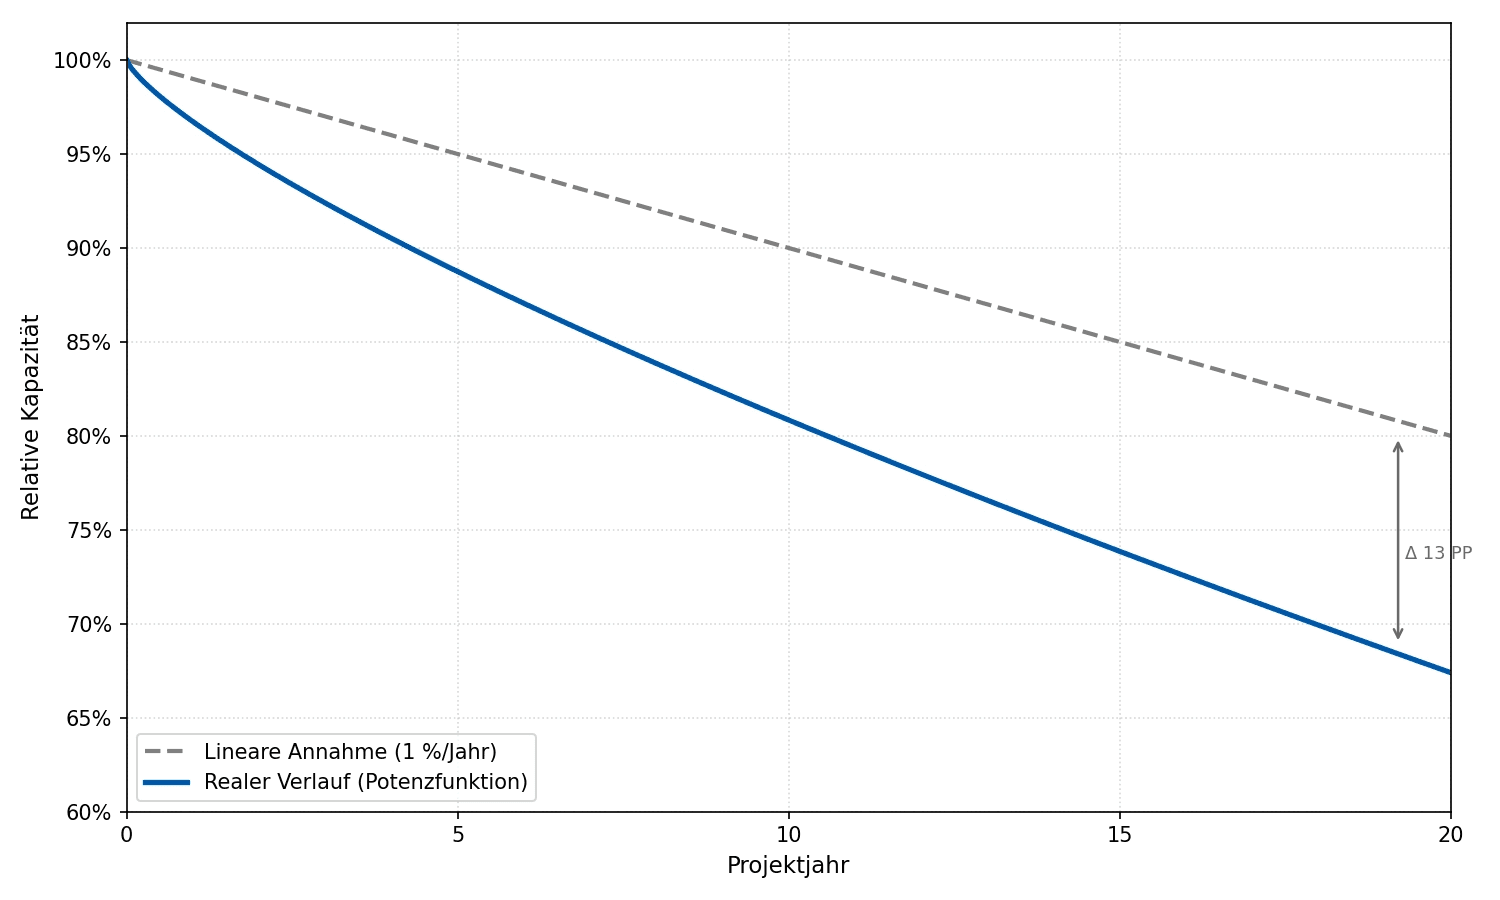
A storage system therefore loses significantly more capacity in the first 1,000 cycles than between cycle 4,000 and 5,000. The degradation follows a flattening curve, not a straight line.
Capacity and efficiency: two effects, one business case
When it comes to battery degradation, most people think of capacity loss. That is correct, but only half the story.
Capacity loss depends on the chemistry
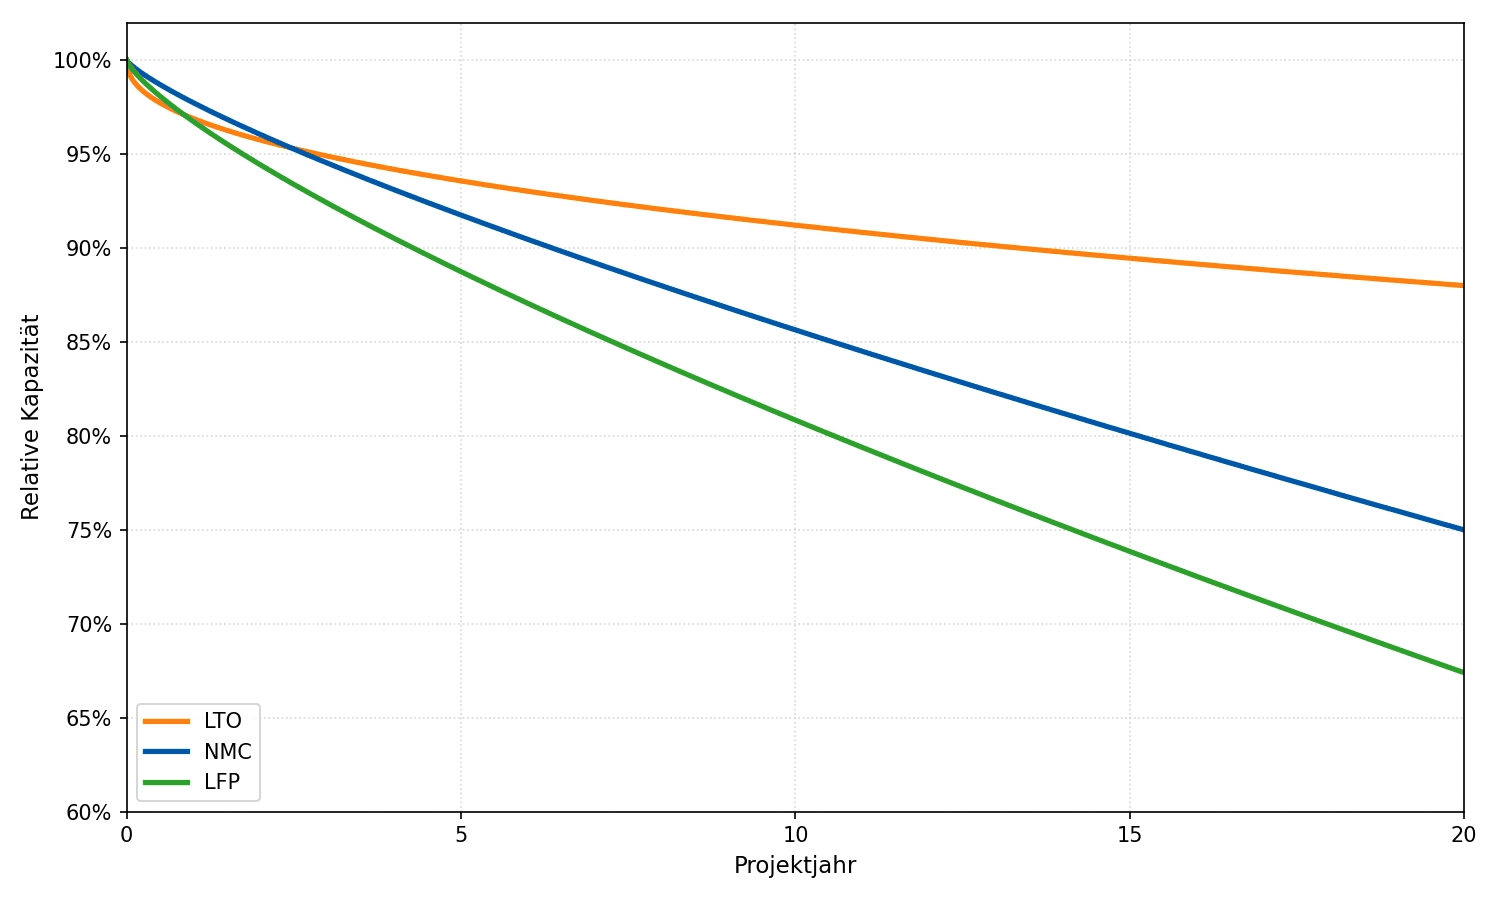
LFP cells (lithium iron phosphate) tolerate significantly more cycles than NMC or NCA cells before they reach their end-of-life threshold. LTO cells are even more robust, but play a lesser role in the C&I sector due to their higher costs.
An LFP system at 365 cycles per year typically still has significantly more usable capacity after 15 years than a comparable NMC system. The curves follow the same basic shape, but run at different steepness, which should be taken into account when selecting and sizing a system.
Efficiency degradation: the often overlooked factor
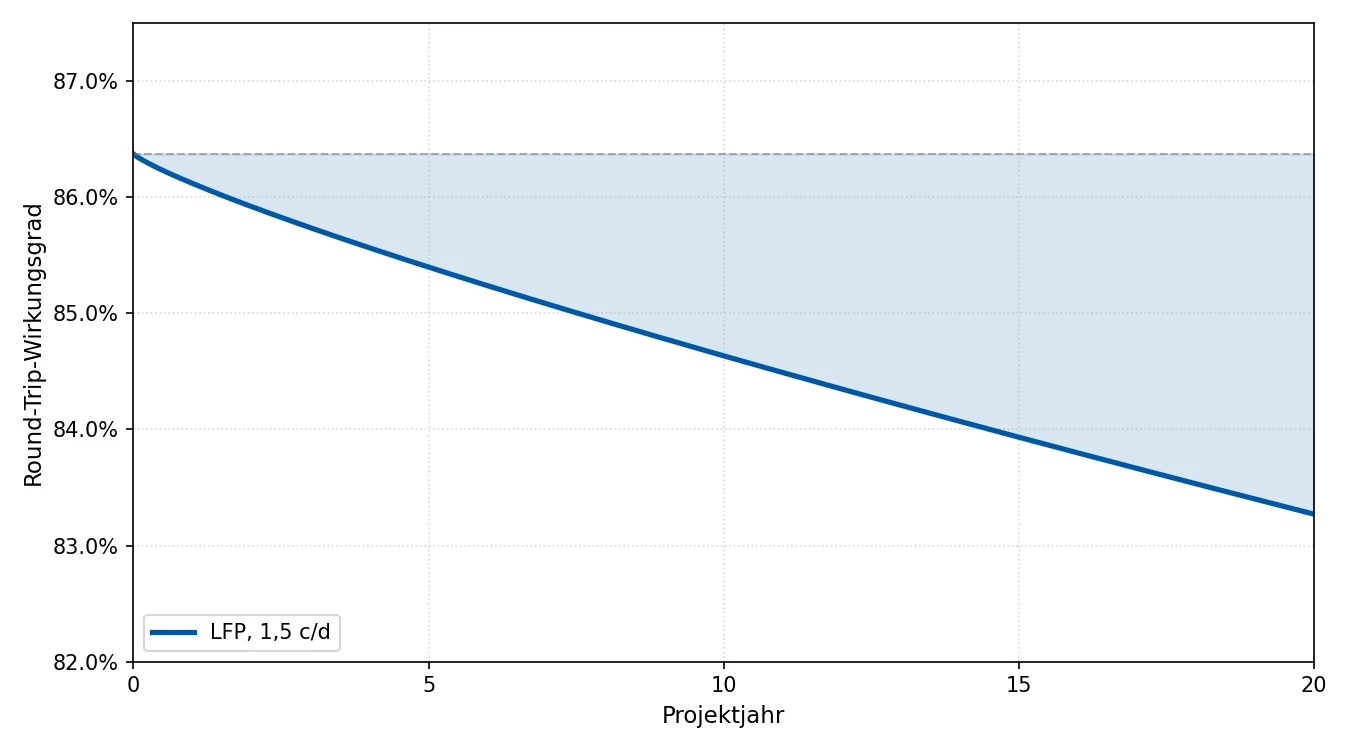
In addition to capacity, the round-trip efficiency (RTE) also declines over the lifetime. The growing SEI layer increases the cell's internal resistance, meaning more losses with every charge and discharge cycle.
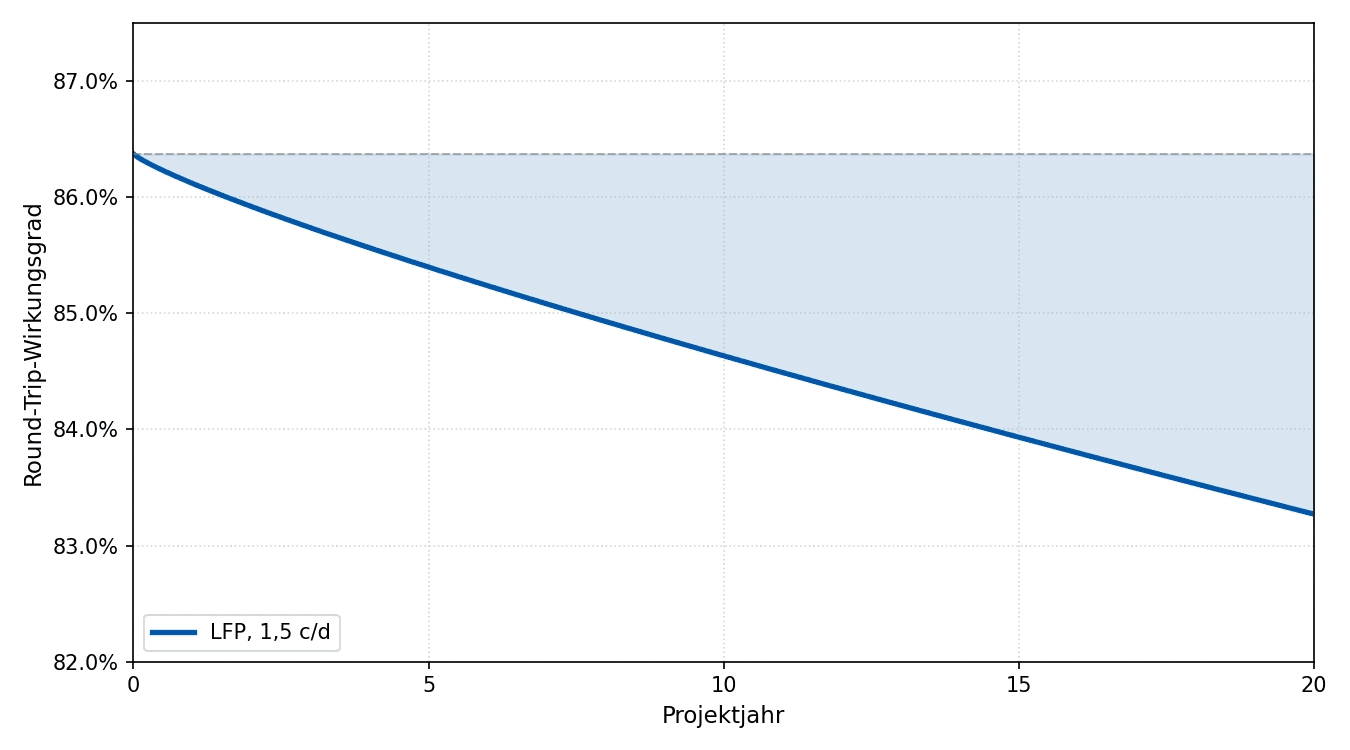
Both effects act simultaneously: less storable energy at lower efficiency adds up to significantly fewer usable kWh than a model that considers only capacity would suggest.
Practical example: what degradation means for the yield
To make the effect tangible, a typical C&I scenario:
Starting point: LFP storage system, 100 kWh, 50 kW, 178 cycles per year, initial RTE 86%.
Without degradation, the economic viability calculation yields constant savings over the entire term, year after year the same usable capacity, the same efficiency.
With a degradation model, the picture looks different: capacity follows a chemistry-specific power function, falling faster at first and then flattening out increasingly. At the same time, the RTE declines from 86% to around 83% depending on the cumulative full cycles (EFCs).
This has a direct impact on revenues: while savings of around €10,600 are still achieved in the first year, in the sixth year they amount to only about €10,100. Over the entire project term this decline adds up, and changes the payback period and the ROI compared to a calculation without degradation.
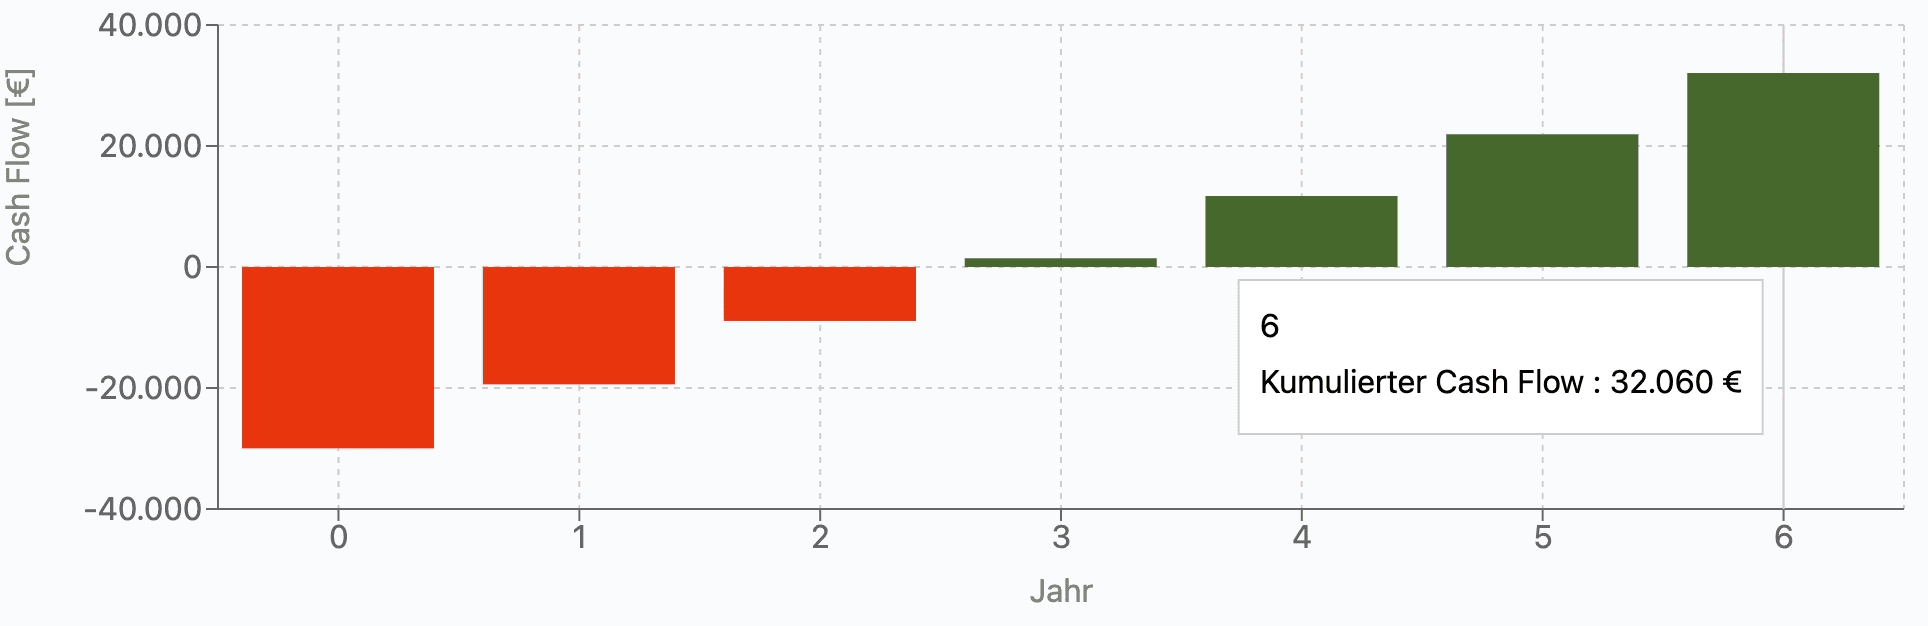
with degradation
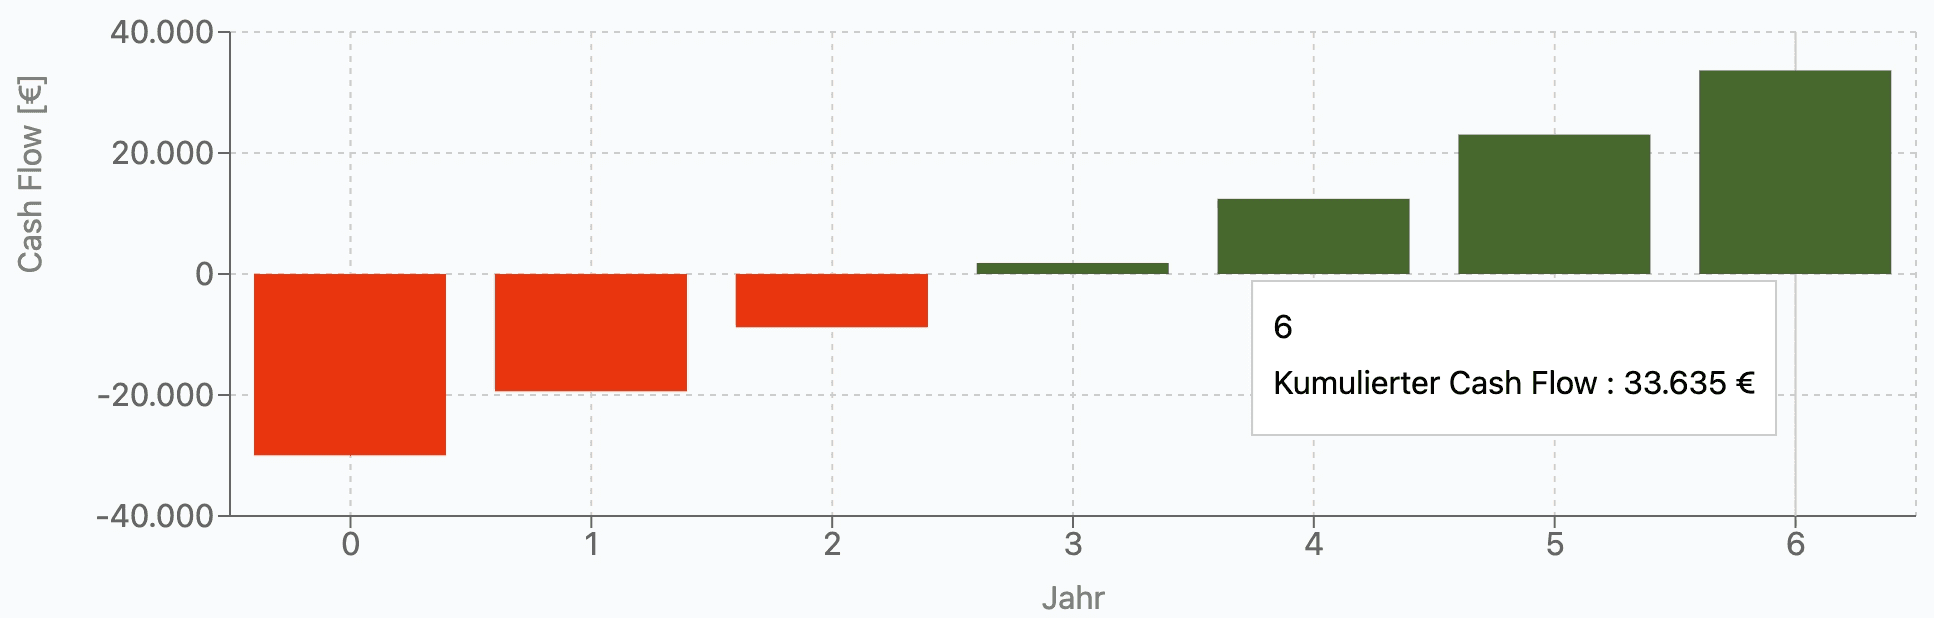
without degradation
Conclusion: degradation belongs at the center of planning
Battery degradation follows a curve that depends on cell chemistry and intensity of use. LFP systems age more slowly than NMC systems, and the efficiency loss significantly affects the amount of usable energy over the project term.
Robust business cases require degradation models that capture both effects, are parameterized in a chemistry-specific way and adapt to the usage profile. In Furo, exactly these models feed directly into the cash flow calculation, so that the economic viability calculation reflects what actually happens inside the battery.
Sources:
Solid–Electrolyte Interphase During Battery Cycling: Theory of Growth Regimes by Lars von Kolzenberg, Arnulf Latz, and Birger Horstmann (Chemistry Europe, 2020)
Lithium-Ion Battery Life Model with Electrode Cracking and Early-Life Break-in Processes Kandler Smith, Paul Gasper, Andrew M. Colclasure, Yuta Shimonishi, and Shuhei Yoshida (Journal of The Electrochemical Society, 2021)
Eduardo Redondo-Iglesias, Pascal Venet, Serge Pelissier. Efficiency Degradation Model of Lithium-ion Batteries for Electric Vehicles. IEEE Transactions on Industry Applications, 2018, 55 (2), pp. 1932-1940. ⟨10.1109/TIA.2018.2877166⟩. ⟨hal-01898906v2⟩
Theory of SEI Formation in Rechargeable Batteries: Capacity Fade, Accelerated Aging and Lifetime Prediction, Matthew B. Pinson and Martin Z. Bazant (Journal of The Electrochemical Society, 2012)
More Articles
Plant Certificates for Battery Storage: When You Need One, What It Costs, and How the Process Works
Lumera Energy becomes Furo
Charging a PV storage system with grid power: comparing the rules in Germany (MiSpeL) and Austria
Multiple PV systems at one site – an overview of compensation, meters and billing rules
A systematic electricity supply contract: why the choice of model matters more than the PPA price
When the electricity doesn't belong to the consumer: calculating operator models and PPAs correctly